
View previous work from my website, marketing/design, and data experiences. Work is in chronological order with web pages from my most recent role to graphic design work from my previous roles. Data analytics case studies can be found at the bottom of the page.
Web Design
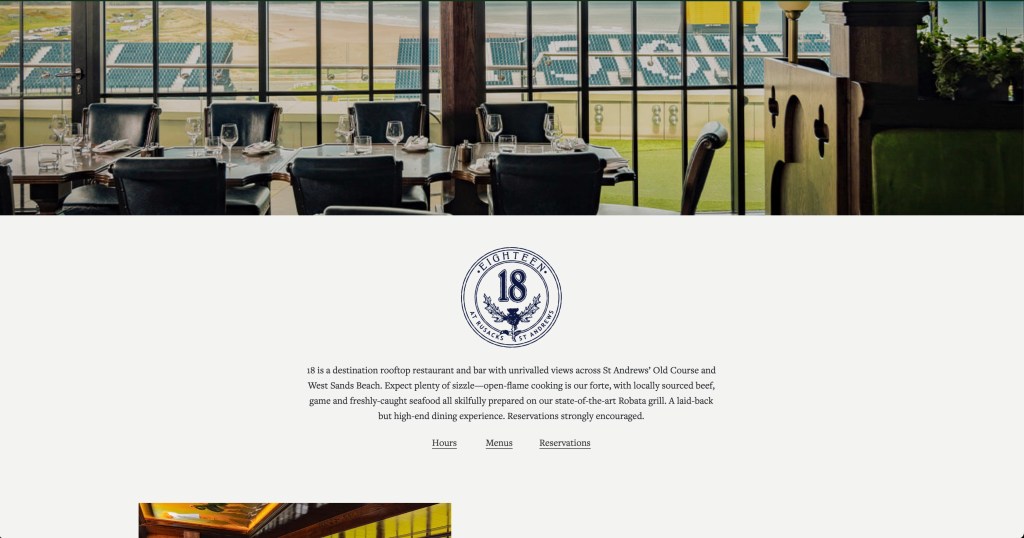
Marine & Lawn – Restaurant Detail Pages
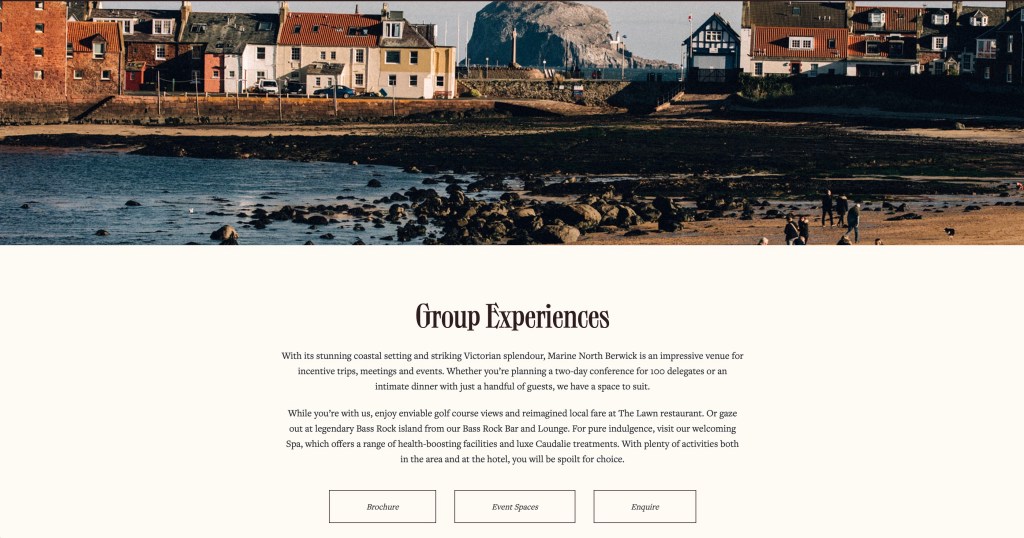
Marine & Lawn – Group Experiences Page

Marine & Lawn – Room Detail Pages Project
Graphic Design

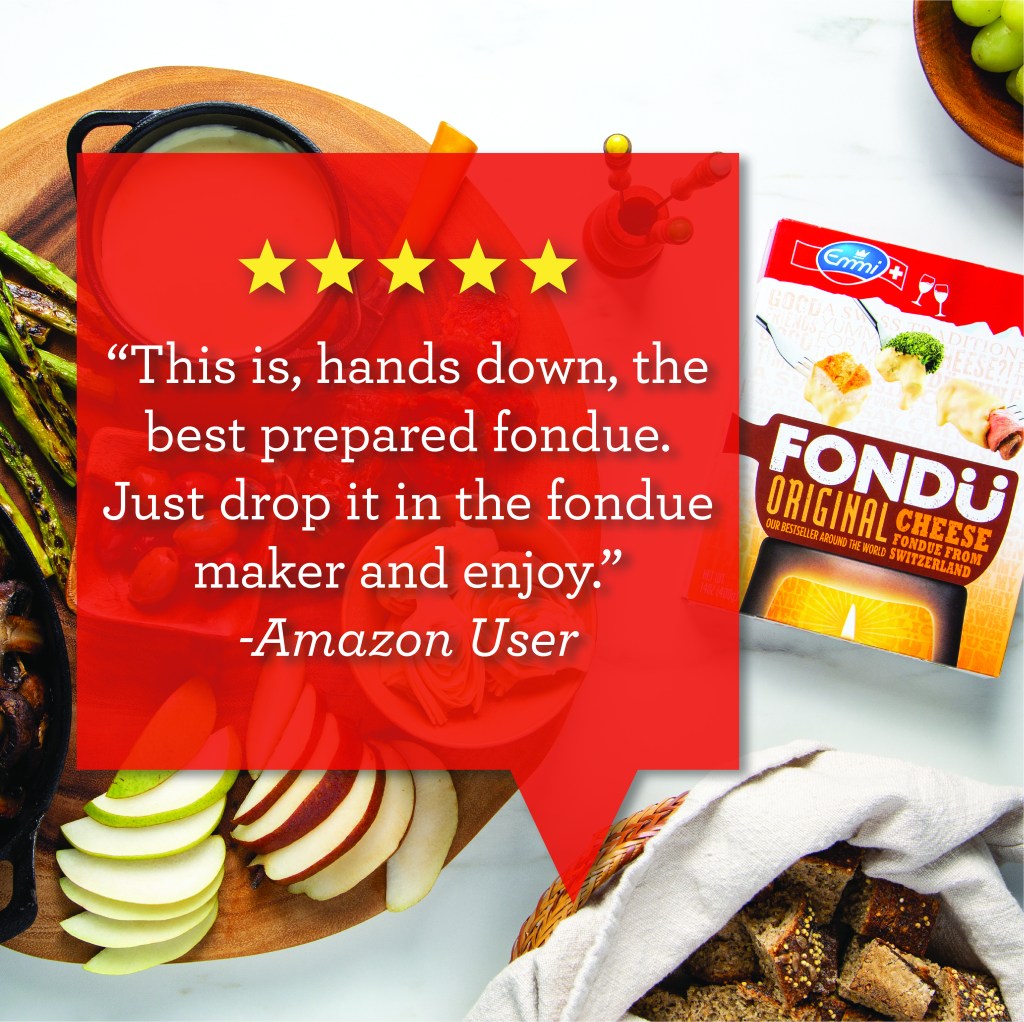

Emmi Roth- Review Tile Images for Amazon Fresh Product Carousels
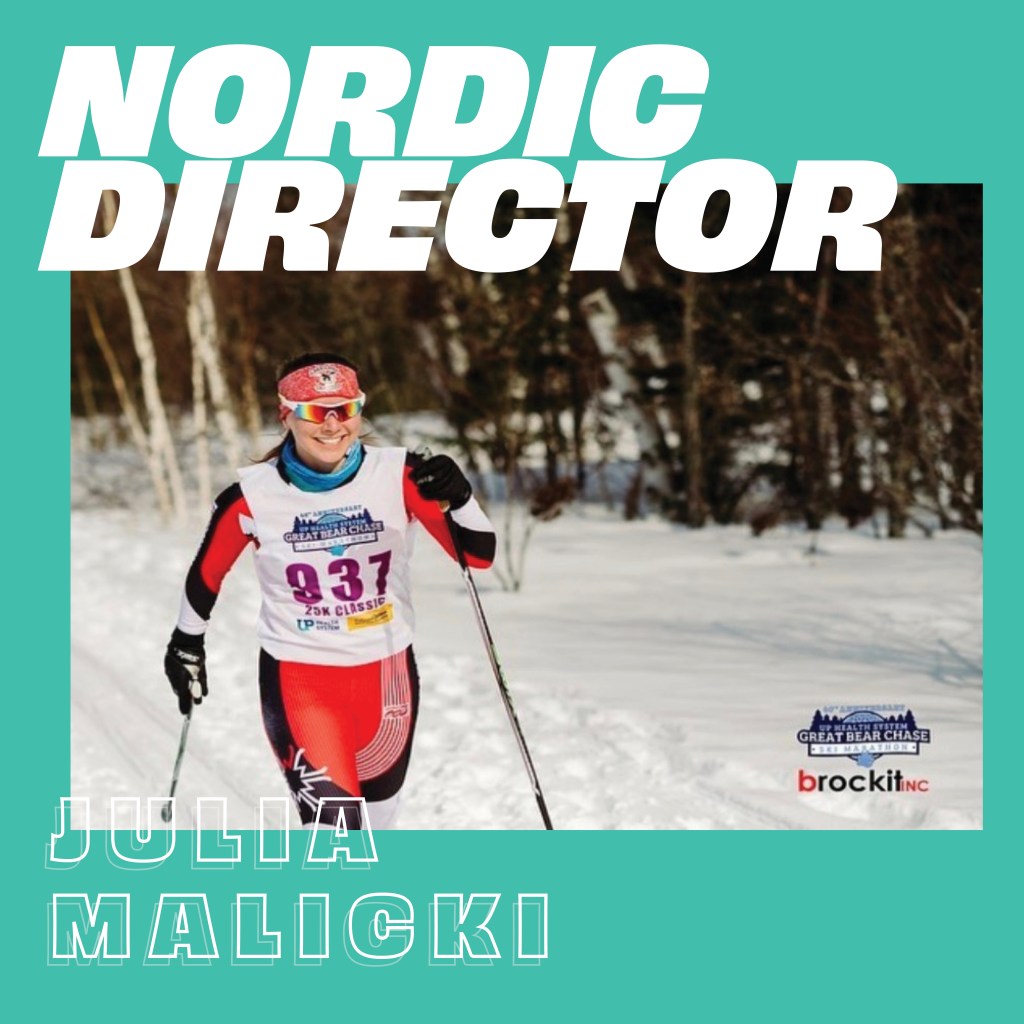
Social Media Post for Ski Club- Meet the Executive Board
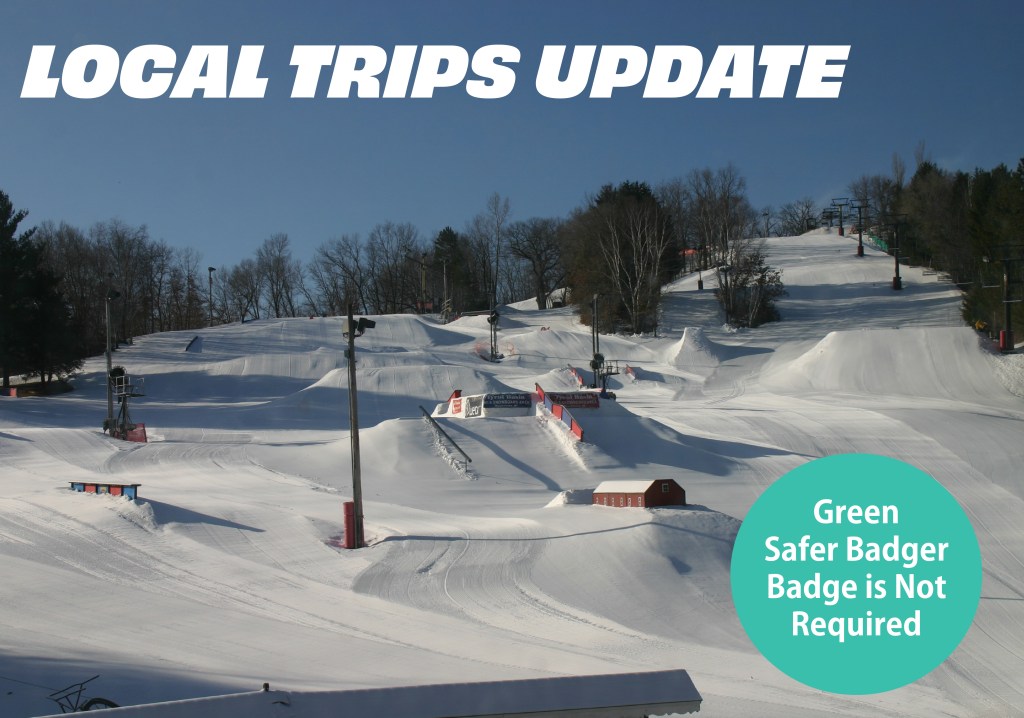
Social Media Story Post for Hoofer Ski Club- Local Trips Update


Social Media Post for Hoofer Ski Club- Freestyle Ski Competition (3 Image Carousel)
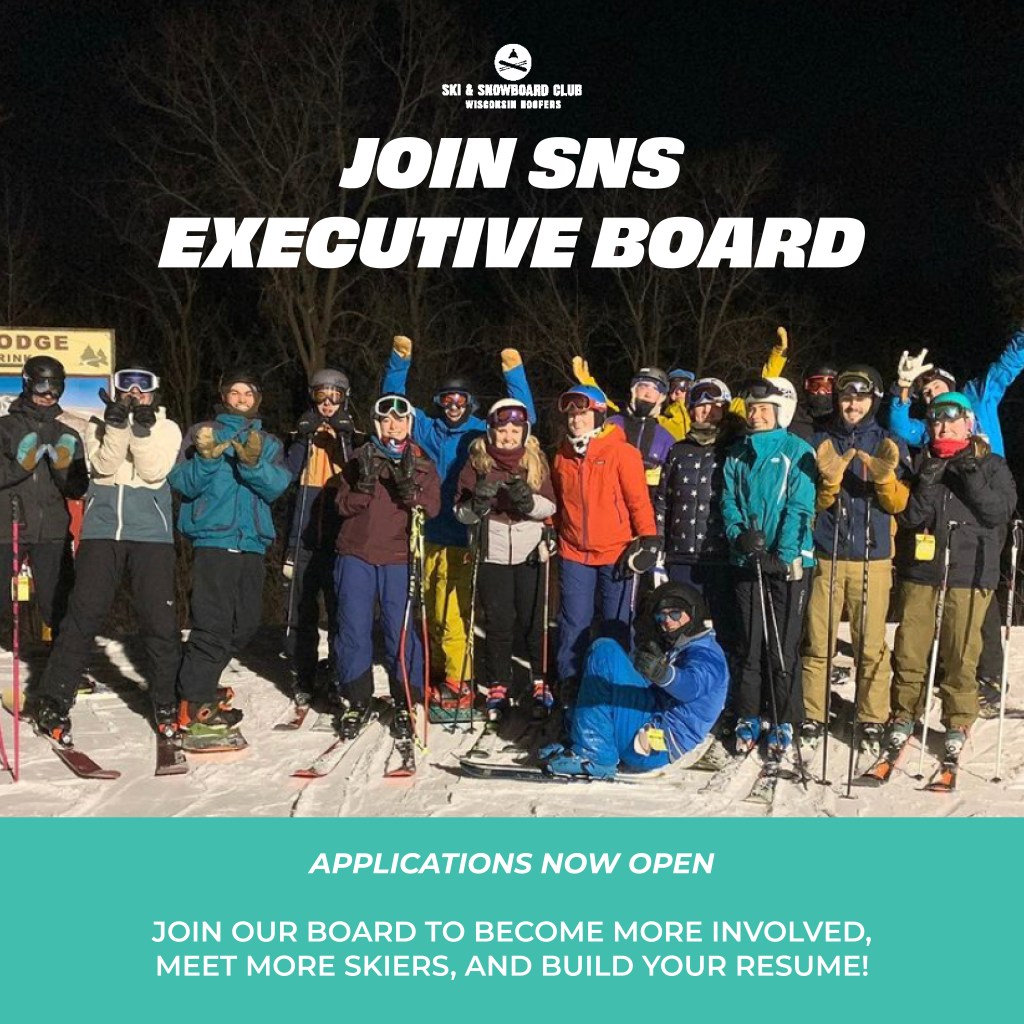
Social Media Post for Hoofer Ski Club- Board Applications Announcement
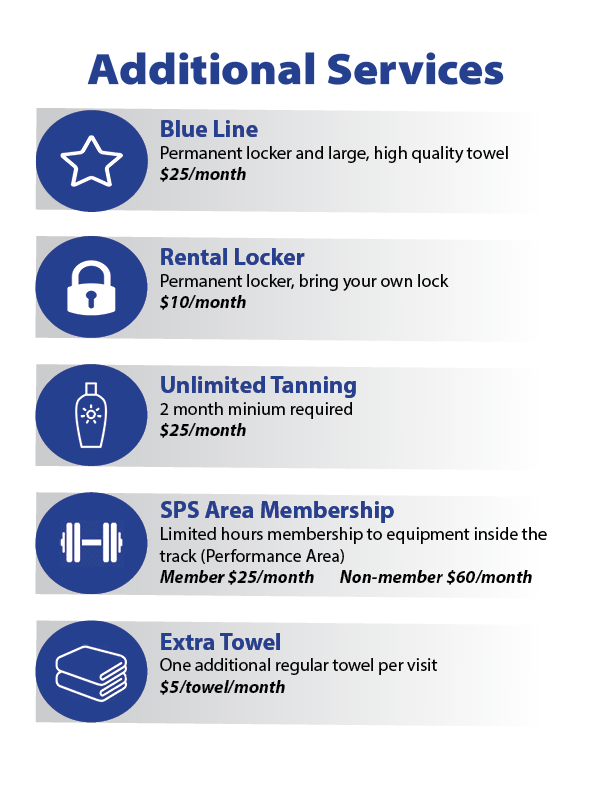
Additional Services Flyer

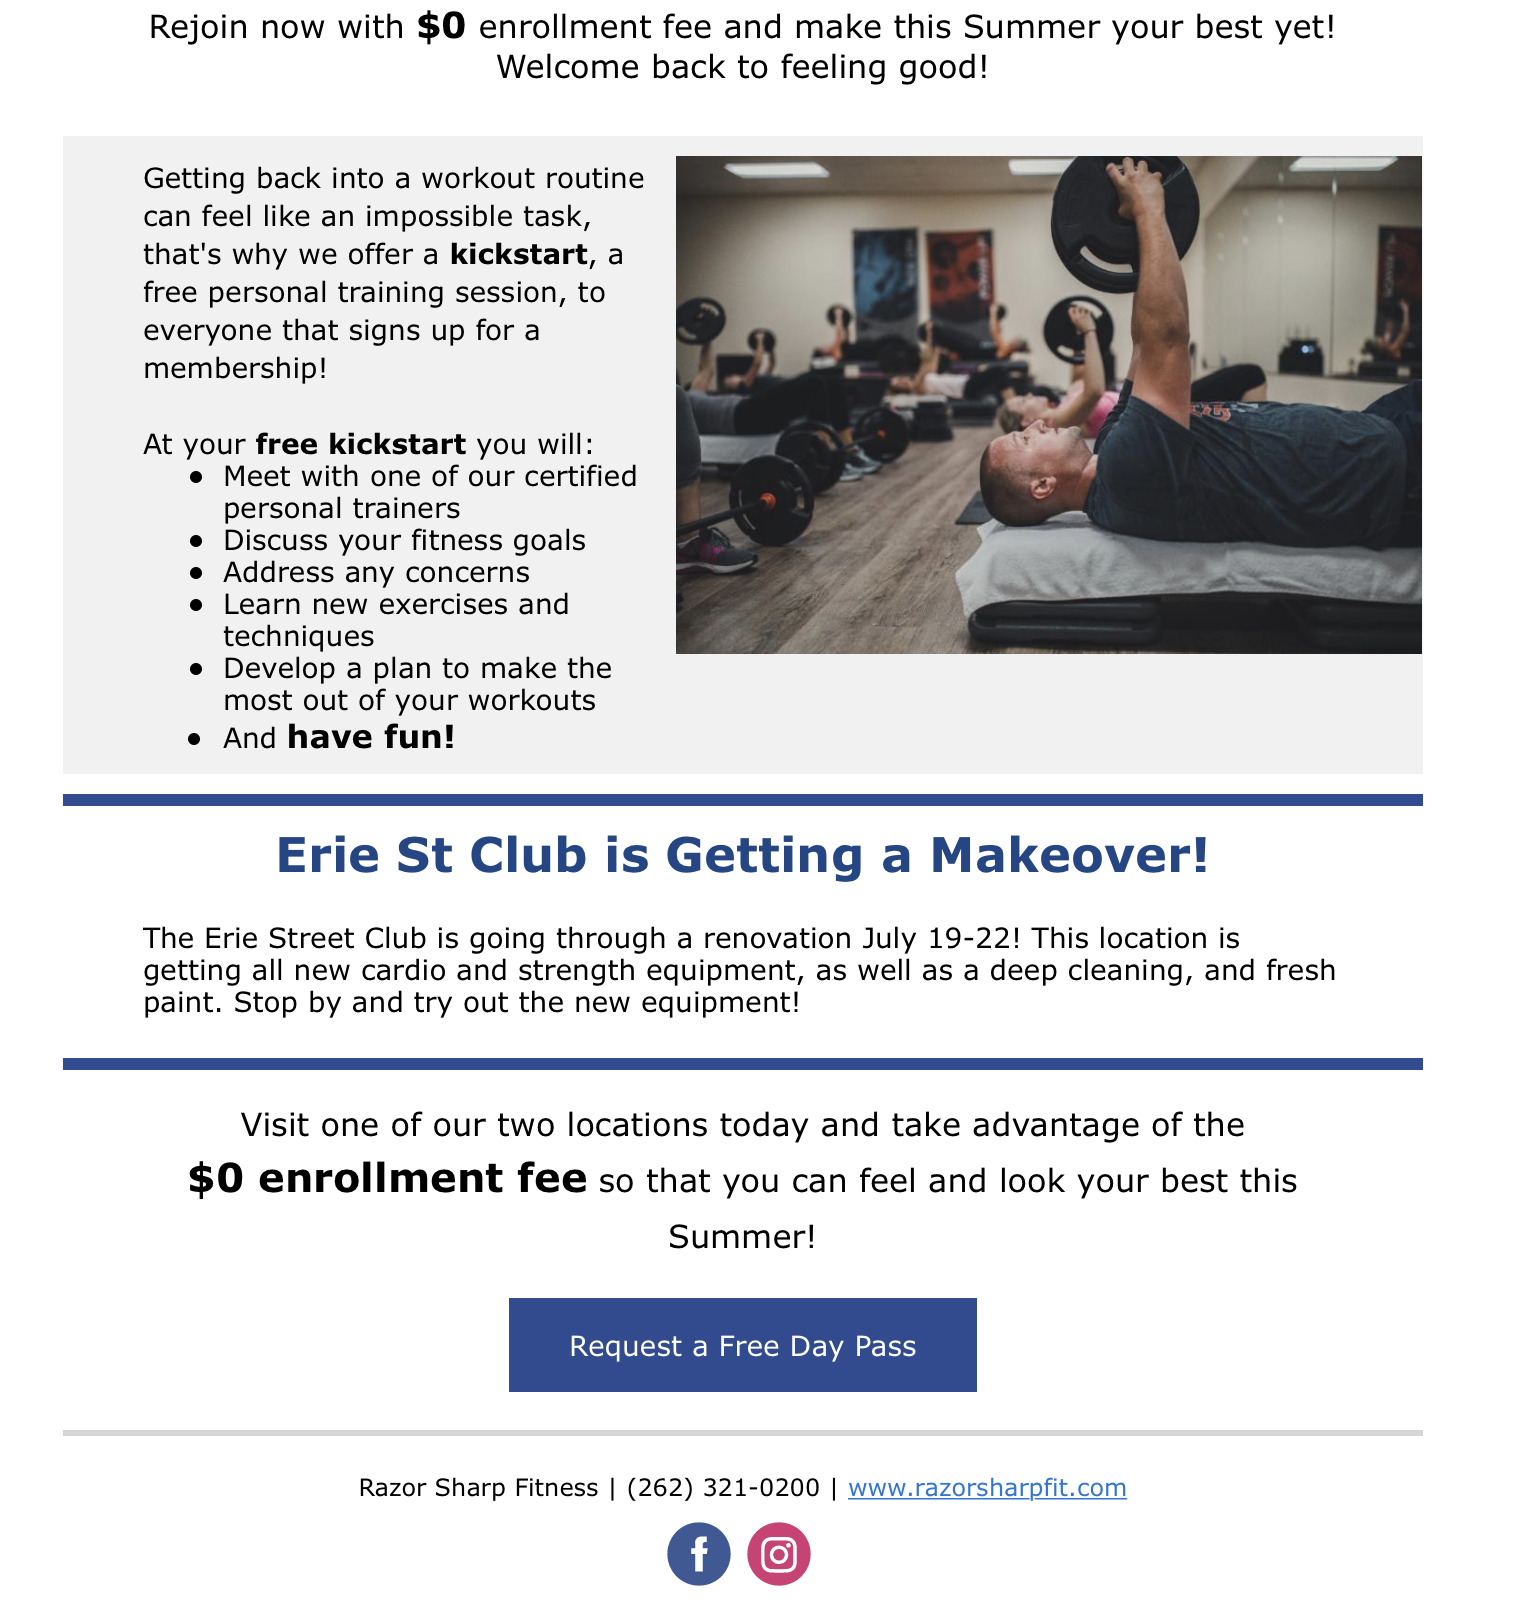
Prospective Member Email


Newsletter Email Campaign

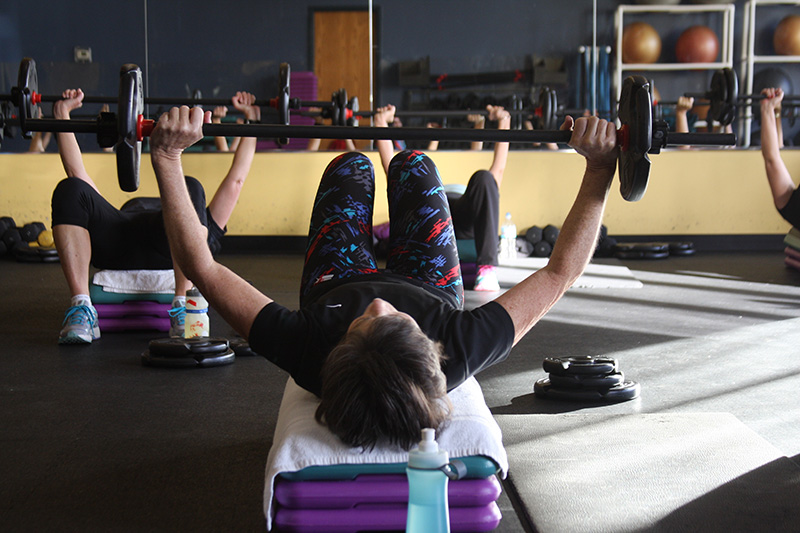
Photography for Fitness Club

Social Media Post Graphic for Hoofers Ski Club- Local Trips Update

Social Media Post for Hoofer Ski Club- Clothing Drive Post

Social Media Post for Hoofer Ski Club- Alumni Outreach Post

Social Media Post for Hoofer Ski Club- Freestyle Ski Competition


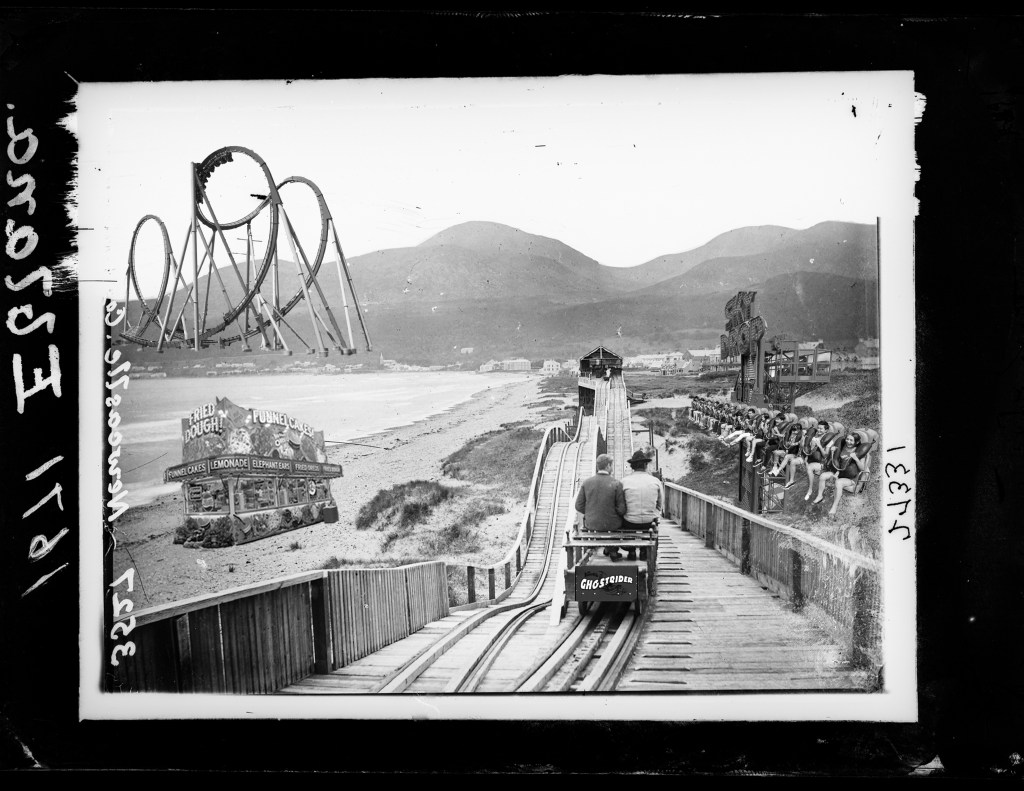
Artwork for UW Intro Graphic Design Course
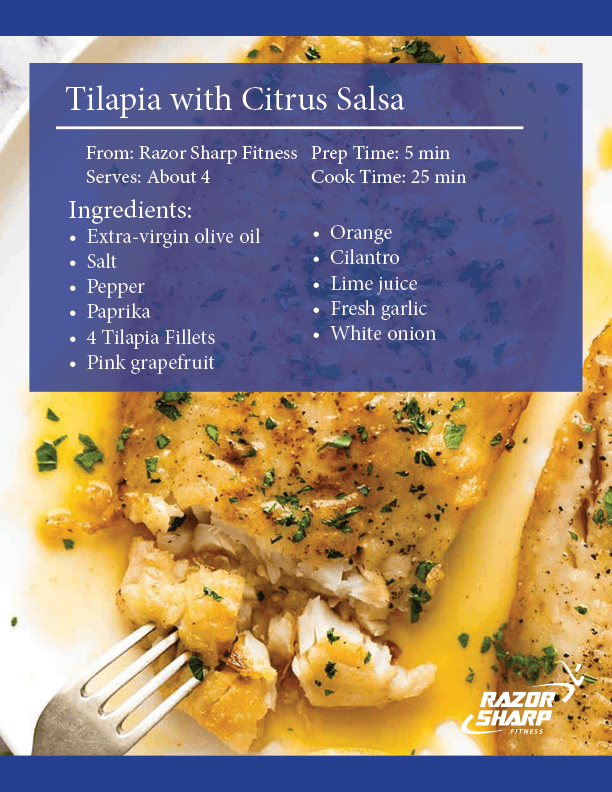

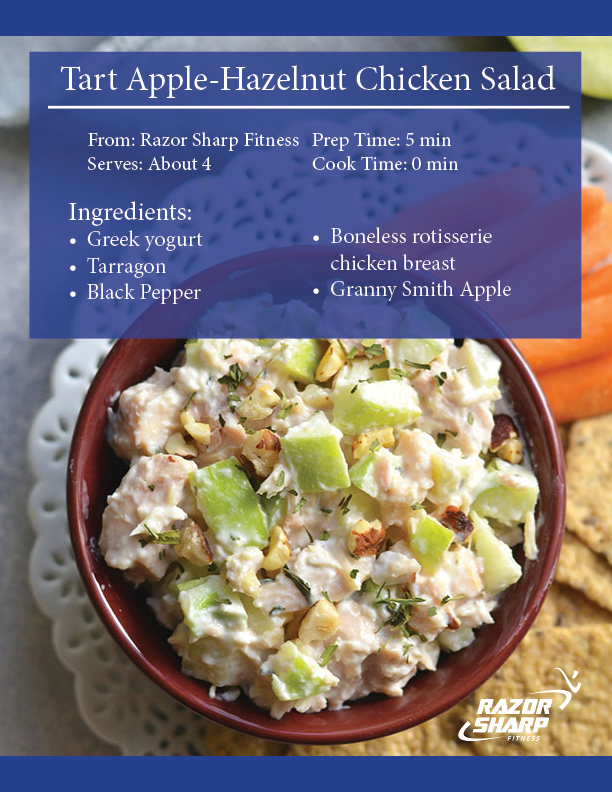
Recipe Flyers for Booth Display

Newsletter Cover Graphic
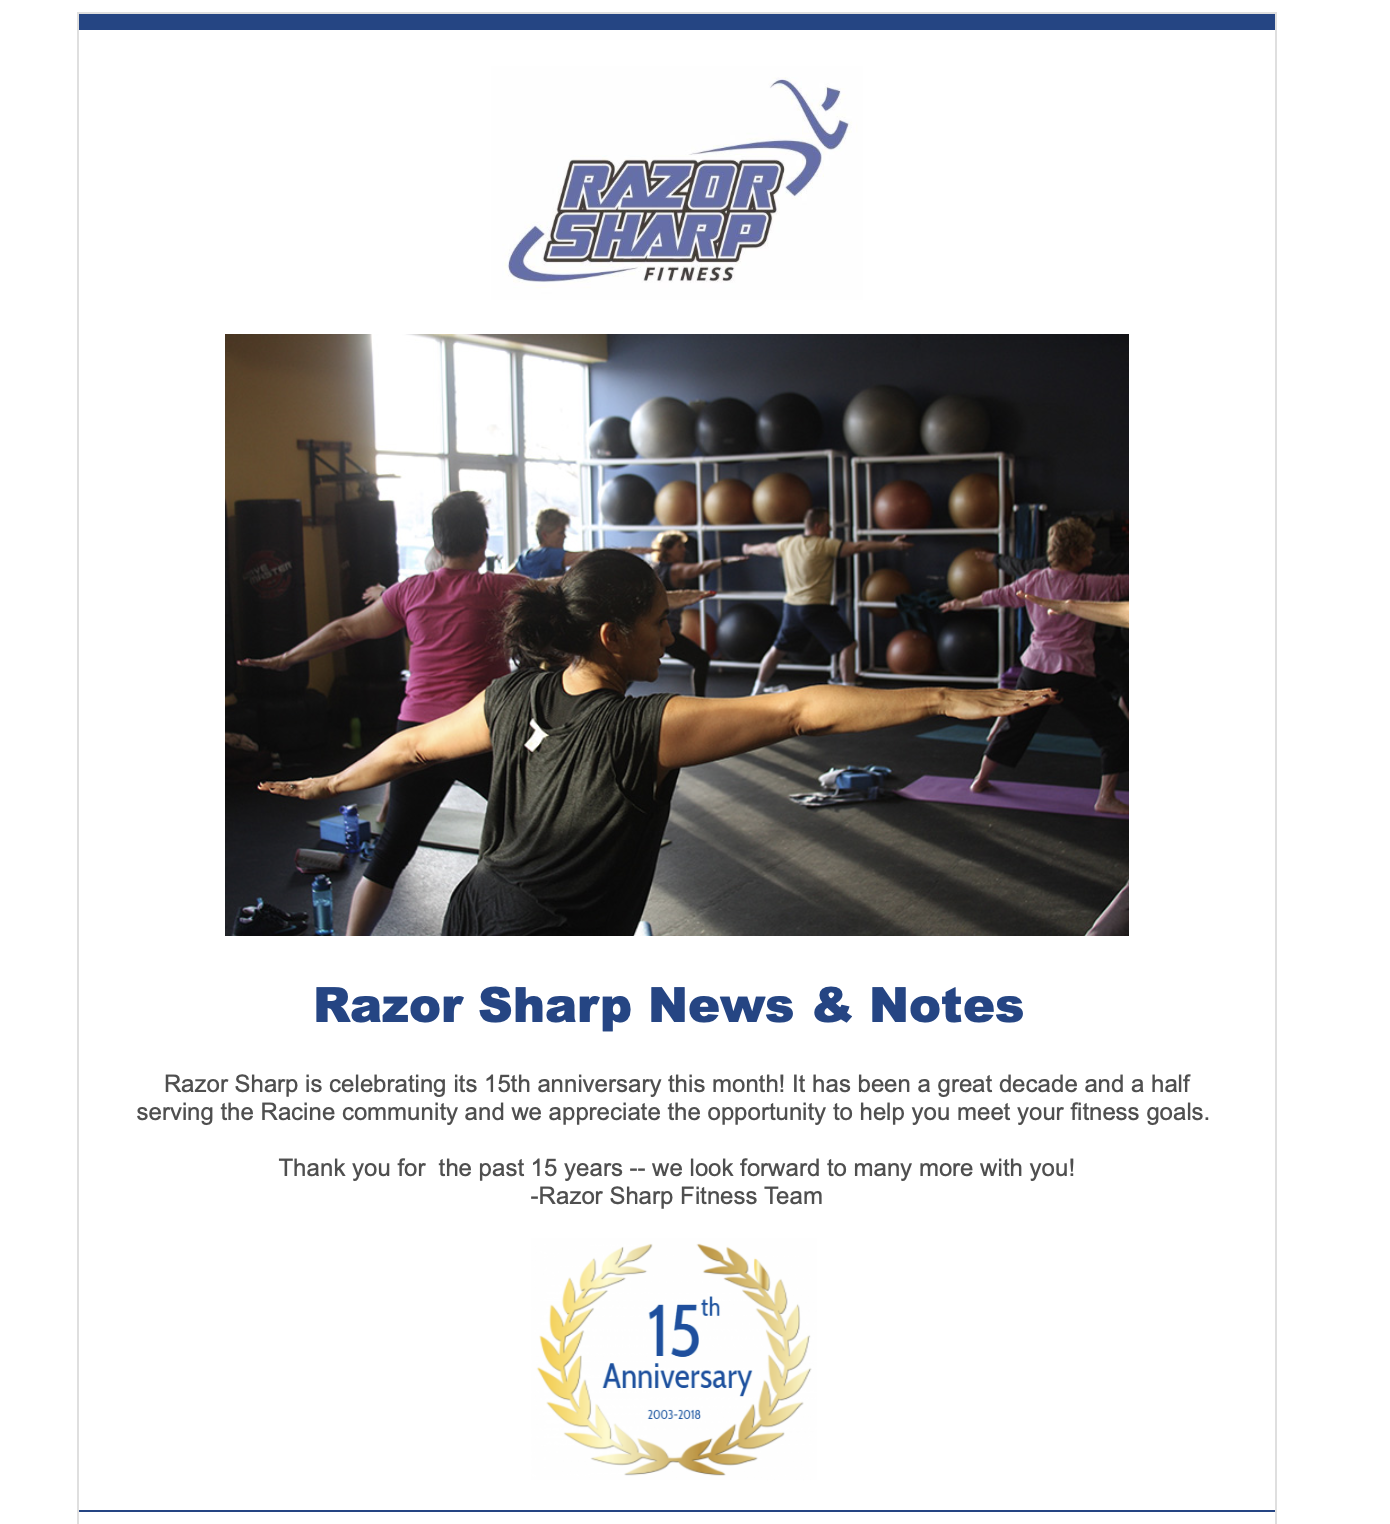


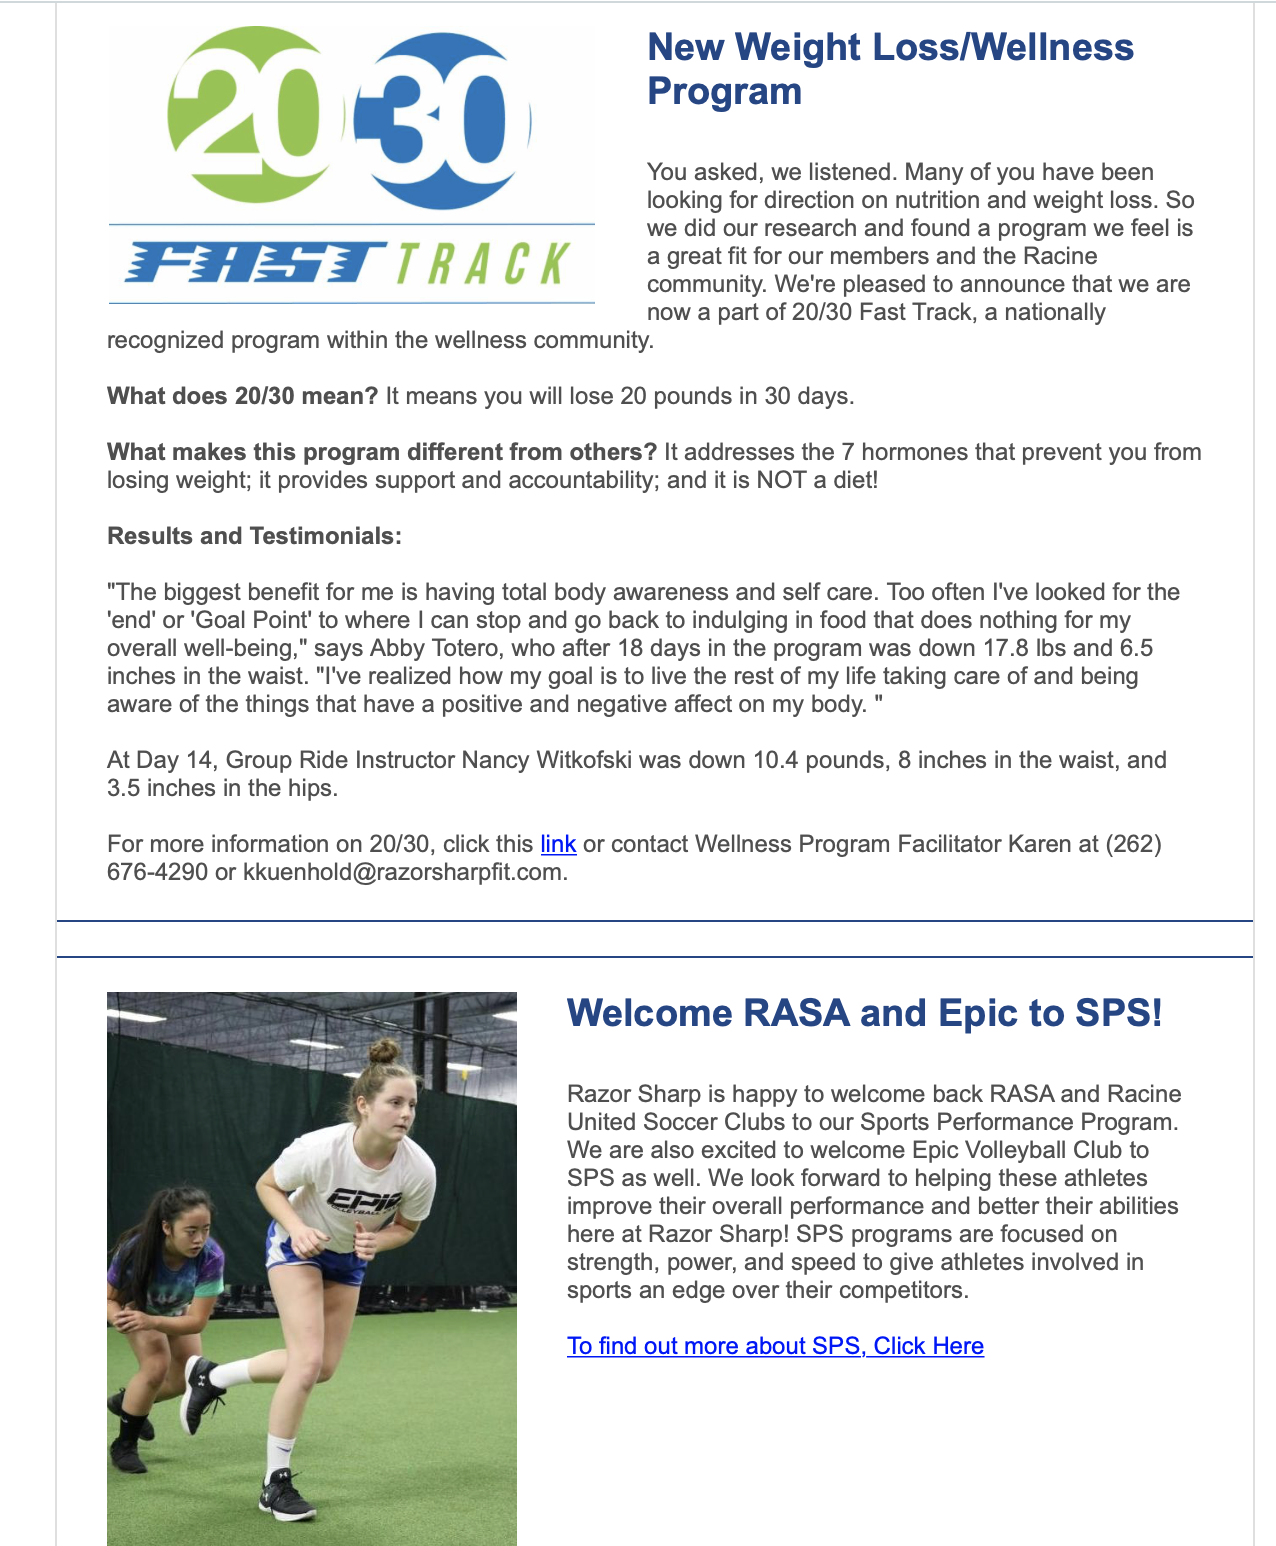

Newsletter Email Campaign
Data Analytics

Consumer Survey Report
Orchestrated a consumer survey analysis, report, and presentation during my time as a marketing intern for Emmi Roth, a domestic and international specialty cheese company. The purpose of the survey was to discover more about how consumers perceive Roth cheese as well as other important buying habits consumers have towards specialty cheese. I utilized SPSS to analyze the survey results and then synthesized the results into a short presentation that was shown to the whole marketing team.

Twitter API and R Analysis Presentation
Conducted an analysis of consumer feelings and reactions about Coca Cola before and after the CEO publicly opposed the voting law passed in Georgia in March 2021. Utilized tweets about the brand and coding in R Studio to determine how the event affected how consumers talked and felt about Coca Cola, as well as the effect on Coca Cola’s stock performance. (Project created for UW Digital Marketing Analytics course.)

IndoCabs Data Analysis Report
IndoCabs, a cab portal company in India, experienced an extensive cancellation problem with their cab bookings which caused them to temporary suspend operation. In an attempt to fix their problem, they needed someone who could identify patterns in their data. I utilized Excel functions, histograms, pivot tables, and graphs to locate the sources of cancellations and recommend to the company ways in which they could reduce their cancellation rate. (This is a fictional case, conducted for a UW business analytics class.)
